Clustering - KMeans Elbow method - Práctica con dataset IRIS
 Jeshua Romero Guadarrama
- 3 Min para leer
- 10 Mar, 2021
Índice de contenido
python
from sklearn import datasets
from sklearn.cluster import KMeans
import pandas as pd
import matplotlib.pyplot as plt
python
iris = datasets.load_iris()
python
iris.feature_names
['sepal length (cm)',
 'sepal width (cm)',
 'petal length (cm)',
 'petal width (cm)']
python
df = pd.DataFrame(iris.data, columns = iris.feature_names)
df
| sepal length (cm) | sepal width (cm) | petal length (cm) | petal width (cm) | |
|---|---|---|---|---|
| 0 | 5.1 | 3.5 | 1.4 | 0.2 |
| 1 | 4.9 | 3.0 | 1.4 | 0.2 |
| 2 | 4.7 | 3.2 | 1.3 | 0.2 |
| 3 | 4.6 | 3.1 | 1.5 | 0.2 |
| 4 | 5.0 | 3.6 | 1.4 | 0.2 |
| ... | ... | ... | ... | ... |
| 145 | 6.7 | 3.0 | 5.2 | 2.3 |
| 146 | 6.3 | 2.5 | 5.0 | 1.9 |
| 147 | 6.5 | 3.0 | 5.2 | 2.0 |
| 148 | 6.2 | 3.4 | 5.4 | 2.3 |
| 149 | 5.9 | 3.0 | 5.1 | 1.8 |
150 rows × 4 columns
python
inertias = []
n_clusters = range(1,10)
for n in n_clusters:
    print("Evaluando n_clusters = ", n)
    knn_model = KMeans(n_clusters = n)
    knn_model.fit(df)
    inertias.append(knn_model.inertia_)
Evaluando n_clusters =  1
Evaluando n_clusters =  2
Evaluando n_clusters =  3
Evaluando n_clusters =  4
Evaluando n_clusters =  5
Evaluando n_clusters =  6
Evaluando n_clusters =  7
Evaluando n_clusters =  8
Evaluando n_clusters =  9
python
inertias
[681.3705999999996,
 152.34795176035797,
 78.851441426146,
 57.22847321428572,
 46.44618205128204,
 39.066035353535376,
 34.42019178628389,
 30.859221634503605,
 28.042265254353516]
python
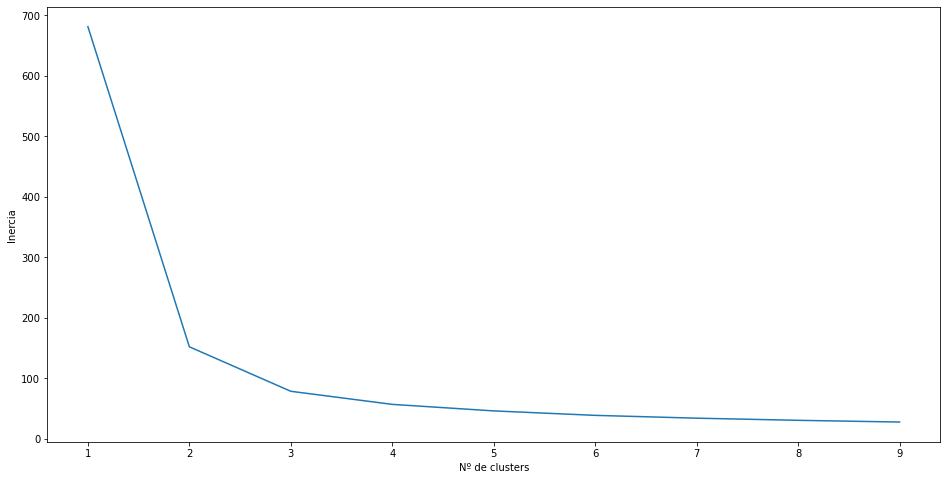
plt.figure(figsize=(16,8))
plt.plot(n_clusters, inertias)
plt.xlabel("Nº de clusters")
plt.ylabel("Inercia")
plt.show()
python
iris.target
array([0, 0, 0, 0, 0, 0, 0, 0, 0, 0, 0, 0, 0, 0, 0, 0, 0, 0, 0, 0, 0, 0,
       0, 0, 0, 0, 0, 0, 0, 0, 0, 0, 0, 0, 0, 0, 0, 0, 0, 0, 0, 0, 0, 0,
       0, 0, 0, 0, 0, 0, 1, 1, 1, 1, 1, 1, 1, 1, 1, 1, 1, 1, 1, 1, 1, 1,
       1, 1, 1, 1, 1, 1, 1, 1, 1, 1, 1, 1, 1, 1, 1, 1, 1, 1, 1, 1, 1, 1,
       1, 1, 1, 1, 1, 1, 1, 1, 1, 1, 1, 1, 2, 2, 2, 2, 2, 2, 2, 2, 2, 2,
       2, 2, 2, 2, 2, 2, 2, 2, 2, 2, 2, 2, 2, 2, 2, 2, 2, 2, 2, 2, 2, 2,
       2, 2, 2, 2, 2, 2, 2, 2, 2, 2, 2, 2, 2, 2, 2, 2, 2, 2])
python
knn_final = KMeans(n_clusters=3)
knn_final.fit(df)
KMeans(n_clusters=3)
python
df["cluster_id"] = knn_final.predict(df)
df
| sepal length (cm) | sepal width (cm) | petal length (cm) | petal width (cm) | cluster_id | |
|---|---|---|---|---|---|
| 0 | 5.1 | 3.5 | 1.4 | 0.2 | 1 |
| 1 | 4.9 | 3.0 | 1.4 | 0.2 | 1 |
| 2 | 4.7 | 3.2 | 1.3 | 0.2 | 1 |
| 3 | 4.6 | 3.1 | 1.5 | 0.2 | 1 |
| 4 | 5.0 | 3.6 | 1.4 | 0.2 | 1 |
| ... | ... | ... | ... | ... | ... |
| 145 | 6.7 | 3.0 | 5.2 | 2.3 | 0 |
| 146 | 6.3 | 2.5 | 5.0 | 1.9 | 2 |
| 147 | 6.5 | 3.0 | 5.2 | 2.0 | 0 |
| 148 | 6.2 | 3.4 | 5.4 | 2.3 | 0 |
| 149 | 5.9 | 3.0 | 5.1 | 1.8 | 2 |
150 rows × 5 columns
python
df["iris_class"] = iris.target
df
| sepal length (cm) | sepal width (cm) | petal length (cm) | petal width (cm) | cluster_id | iris_class | |
|---|---|---|---|---|---|---|
| 0 | 5.1 | 3.5 | 1.4 | 0.2 | 1 | 0 |
| 1 | 4.9 | 3.0 | 1.4 | 0.2 | 1 | 0 |
| 2 | 4.7 | 3.2 | 1.3 | 0.2 | 1 | 0 |
| 3 | 4.6 | 3.1 | 1.5 | 0.2 | 1 | 0 |
| 4 | 5.0 | 3.6 | 1.4 | 0.2 | 1 | 0 |
| ... | ... | ... | ... | ... | ... | ... |
| 145 | 6.7 | 3.0 | 5.2 | 2.3 | 0 | 2 |
| 146 | 6.3 | 2.5 | 5.0 | 1.9 | 2 | 2 |
| 147 | 6.5 | 3.0 | 5.2 | 2.0 | 0 | 2 |
| 148 | 6.2 | 3.4 | 5.4 | 2.3 | 0 | 2 |
| 149 | 5.9 | 3.0 | 5.1 | 1.8 | 2 | 2 |
150 rows × 6 columns
python
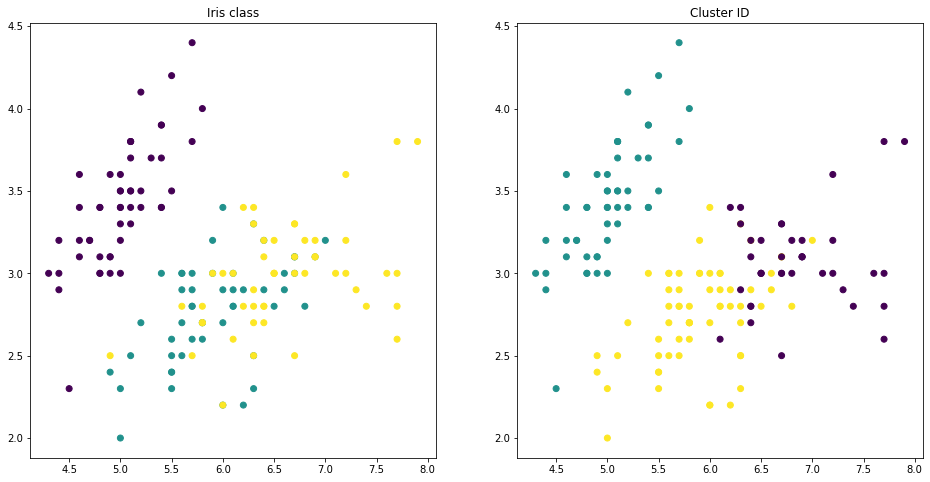
fig, axes = plt.subplots(1, 2, figsize=(16,8))
axes[0].scatter(df["sepal length (cm)"], df["sepal width (cm)"], c = df.iris_class)
axes[0].set_title("Iris class")

axes[1].scatter(df["sepal length (cm)"], df["sepal width (cm)"], c = df.cluster_id)
axes[1].set_title("Cluster ID")
Text(0.5, 1.0, 'Cluster ID')