
Escalado y normalización de variables
 Jeshua Romero Guadarrama
- 3 Min para leer
- 05 May, 2021
Índice de contenido
Estandarización
Xescalada = (X - Xmedia)/Xstd
python
from sklearn import preprocessing
import numpy as np
import matplotlib.pyplot as plt
Con preprocessing.scale()
python
X_train = np.array([[ 1., -1.,  2.],
                    [ 2.,  0.,  0.],
                    [ 0.,  1., -1.]])
python
X_train.ndim
2
python
X_scaled = preprocessing.scale(X_train)
X_scaled
array([[ 0.        , -1.22474487,  1.33630621],
       [ 1.22474487,  0.        , -0.26726124],
       [-1.22474487,  1.22474487, -1.06904497]])
python
X_scaled.mean()
4.9343245538895844e-17
python
X_scaled.var()
1.0
Con preprocessing.StandardScaler()
python
scaler = preprocessing.StandardScaler()
python
fitted_scaler = scaler.fit(X_train)
fitted_scaler
StandardScaler()
python
fitted_scaler.mean_
array([1. , 0. , 0.33333333])
python
X_scaled_st = fitted_scaler.transform(X_train)
X_scaled_st
array([[ 0.        , -1.22474487,  1.33630621],
       [ 1.22474487,  0.        , -0.26726124],
       [-1.22474487,  1.22474487, -1.06904497]])
python
X_scaled_st.mean()
4.9343245538895844e-17
python
X_scaled_st.var()
1.0
Ejemplo para ver efecto de distorsión
python
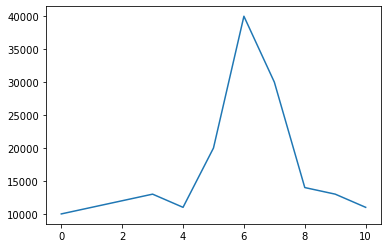
X = [10000, 11000, 12000, 13000, 11000, 20000, 40000, 30000, 14000, 13000, 11000]
X
[10000, 11000, 12000, 13000, 11000, 20000, 40000, 30000, 14000, 13000, 11000]
python
plt.plot(X)
[<matplotlib.lines.Line2D at 0xb9517c0>]
python
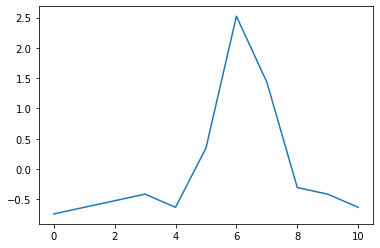
X_scaled2 = preprocessing.scale(X)
X_scaled2
array([-0.741666  , -0.63288832, -0.52411064, -0.41533296, -0.63288832,
        0.3461108 ,  2.52166439,  1.4338876 , -0.30655528, -0.41533296,
       -0.63288832])
python
plt.plot(X_scaled2)
[<matplotlib.lines.Line2D at 0xba55250>]
Escalado de datos en un rango
MinMaxScaler
python
from sklearn.preprocessing import MinMaxScaler
python
data = [[-1, 2], [-0.5, 6], [0, 10], [1, 18]]
data
[[-1, 2], [-0.5, 6], [0, 10], [1, 18]]
python
scaler = MinMaxScaler()
python
fitted_scaler = scaler.fit(data)
python
fitted_scaler.transform(data)
array([[0.  , 0.  ],
       [0.25, 0.25],
       [0.5 , 0.5 ],
       [1.  , 1.  ]])
python
scaler_2 = MinMaxScaler(feature_range = (5,10))
python
fitted_scaler_2 = scaler_2.fit(data)
python
fitted_scaler_2.transform(data)
array([[ 5.  ,  5.  ],
       [ 6.25,  6.25],
       [ 7.5 ,  7.5 ],
       [10.  , 10.  ]])
Ejemplo de distorsión
python
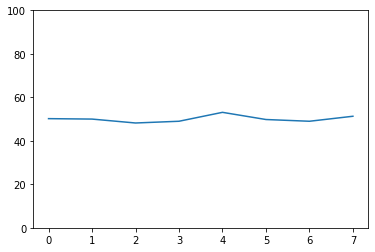
señal = np.array([50.2, 50., 48.2, 49., 53.1, 49.8, 49., 51.3])
señal
array([50.2, 50. , 48.2, 49. , 53.1, 49.8, 49. , 51.3])
python
plt.plot(señal)
plt.ylim(0,100)
(0.0, 100.0)
python
scaler_3 = MinMaxScaler()
fitted_scaler_3 = scaler_3.fit(señal.reshape(-1, 1))
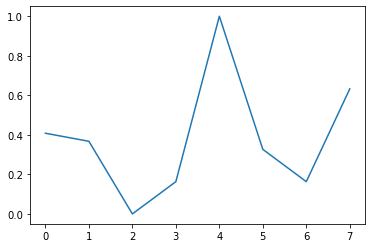
señal_escalada = fitted_scaler_3.transform(señal.reshape(-1, 1))
señal_escalada
array([[0.40816327],
       [0.36734694],
       [0.        ],
       [0.16326531],
       [1.        ],
       [0.32653061],
       [0.16326531],
       [0.63265306]])
python
plt.plot(señal_escalada)
[<matplotlib.lines.Line2D at 0xbcb6190>]
MaxAbsScaler
python
from sklearn.preprocessing import MaxAbsScaler
python
X = [[ 1., -1.,  2.],
     [ 2.,  0.,  0.],
     [ 0.,  1., -1.]]
python
transformer = MaxAbsScaler()
adj_transformer = transformer.fit(X)
results = adj_transformer.transform(X)
results
array([[ 0.5, -1. ,  1. ],
       [ 1. ,  0. ,  0. ],
       [ 0. ,  1. , -0.5]])
Normalización de vectores
python
from sklearn import preprocessing
python
X = [[ 1., -1.,  2.],
      [ 2.,  0.,  0.],
      [ 0.,  1., -1.]]
python
X_normalized_l1 = preprocessing.normalize(X, norm="l1")
X_normalized_l1
array([[ 0.25, -0.25,  0.5 ],
       [ 1.  ,  0.  ,  0.  ],
       [ 0.  ,  0.5 , -0.5 ]])
python
X_normalized_l2 = preprocessing.normalize(X, norm="l2")
X_normalized_l2
array([[ 0.40824829, -0.40824829,  0.81649658],
       [ 1.        ,  0.        ,  0.        ],
       [ 0.        ,  0.70710678, -0.70710678]])