
Nearest Neighbors - Práctica de clasificación
 Jeshua Romero Guadarrama
- 6 Min para leer
- 06 Jun, 2021
Índice de contenido
python
import numpy as np
import pandas as pd
import matplotlib.pyplot as plt
from sklearn import datasets, neighbors
from sklearn.model_selection import train_test_split
python
iris = datasets.load_iris(as_frame = True)
iris.data
| sepal length (cm) | sepal width (cm) | petal length (cm) | petal width (cm) | |
|---|---|---|---|---|
| 0 | 5.1 | 3.5 | 1.4 | 0.2 |
| 1 | 4.9 | 3.0 | 1.4 | 0.2 |
| 2 | 4.7 | 3.2 | 1.3 | 0.2 |
| 3 | 4.6 | 3.1 | 1.5 | 0.2 |
| 4 | 5.0 | 3.6 | 1.4 | 0.2 |
| ... | ... | ... | ... | ... |
| 145 | 6.7 | 3.0 | 5.2 | 2.3 |
| 146 | 6.3 | 2.5 | 5.0 | 1.9 |
| 147 | 6.5 | 3.0 | 5.2 | 2.0 |
| 148 | 6.2 | 3.4 | 5.4 | 2.3 |
| 149 | 5.9 | 3.0 | 5.1 | 1.8 |
150 rows × 4 columns
python
iris.target
0      0
1      0
2      0
3      0
4      0
      ..
145    2
146    2
147    2
148    2
149    2
Name: target, Length: 150, dtype: int32
python
df = pd.concat([iris.data, iris.target],
              axis = 1)
df
| sepal length (cm) | sepal width (cm) | petal length (cm) | petal width (cm) | target | |
|---|---|---|---|---|---|
| 0 | 5.1 | 3.5 | 1.4 | 0.2 | 0 |
| 1 | 4.9 | 3.0 | 1.4 | 0.2 | 0 |
| 2 | 4.7 | 3.2 | 1.3 | 0.2 | 0 |
| 3 | 4.6 | 3.1 | 1.5 | 0.2 | 0 |
| 4 | 5.0 | 3.6 | 1.4 | 0.2 | 0 |
| ... | ... | ... | ... | ... | ... |
| 145 | 6.7 | 3.0 | 5.2 | 2.3 | 2 |
| 146 | 6.3 | 2.5 | 5.0 | 1.9 | 2 |
| 147 | 6.5 | 3.0 | 5.2 | 2.0 | 2 |
| 148 | 6.2 | 3.4 | 5.4 | 2.3 | 2 |
| 149 | 5.9 | 3.0 | 5.1 | 1.8 | 2 |
150 rows × 5 columns
python
df.target.unique()
array([0, 1, 2])
python
sum(df.target == 2)
50
python
df = df.loc[df.target.isin([0, 1])]
df
| sepal length (cm) | sepal width (cm) | petal length (cm) | petal width (cm) | target | |
|---|---|---|---|---|---|
| 0 | 5.1 | 3.5 | 1.4 | 0.2 | 0 |
| 1 | 4.9 | 3.0 | 1.4 | 0.2 | 0 |
| 2 | 4.7 | 3.2 | 1.3 | 0.2 | 0 |
| 3 | 4.6 | 3.1 | 1.5 | 0.2 | 0 |
| 4 | 5.0 | 3.6 | 1.4 | 0.2 | 0 |
| ... | ... | ... | ... | ... | ... |
| 95 | 5.7 | 3.0 | 4.2 | 1.2 | 1 |
| 96 | 5.7 | 2.9 | 4.2 | 1.3 | 1 |
| 97 | 6.2 | 2.9 | 4.3 | 1.3 | 1 |
| 98 | 5.1 | 2.5 | 3.0 | 1.1 | 1 |
| 99 | 5.7 | 2.8 | 4.1 | 1.3 | 1 |
100 rows × 5 columns
python
df = df[["sepal length (cm)", "sepal width (cm)", "target"]]
df
| sepal length (cm) | sepal width (cm) | target | |
|---|---|---|---|
| 0 | 5.1 | 3.5 | 0 |
| 1 | 4.9 | 3.0 | 0 |
| 2 | 4.7 | 3.2 | 0 |
| 3 | 4.6 | 3.1 | 0 |
| 4 | 5.0 | 3.6 | 0 |
| ... | ... | ... | ... |
| 95 | 5.7 | 3.0 | 1 |
| 96 | 5.7 | 2.9 | 1 |
| 97 | 6.2 | 2.9 | 1 |
| 98 | 5.1 | 2.5 | 1 |
| 99 | 5.7 | 2.8 | 1 |
100 rows × 3 columns
python
df.columns
Index(['sepal length (cm)', 'sepal width (cm)', 'target'], dtype='object')
python
X = df.loc[:, df.columns != "target"]
X
| sepal length (cm) | sepal width (cm) | |
|---|---|---|
| 0 | 5.1 | 3.5 |
| 1 | 4.9 | 3.0 |
| 2 | 4.7 | 3.2 |
| 3 | 4.6 | 3.1 |
| 4 | 5.0 | 3.6 |
| ... | ... | ... |
| 95 | 5.7 | 3.0 |
| 96 | 5.7 | 2.9 |
| 97 | 6.2 | 2.9 |
| 98 | 5.1 | 2.5 |
| 99 | 5.7 | 2.8 |
100 rows × 2 columns
python
y = df.target
y
0     0
1     0
2     0
3     0
4     0
     ..
95    1
96    1
97    1
98    1
99    1
Name: target, Length: 100, dtype: int32
python
class_0 = df[df["target"] == 0]
class_0
| sepal length (cm) | sepal width (cm) | target | |
|---|---|---|---|
| 0 | 5.1 | 3.5 | 0 |
| 1 | 4.9 | 3.0 | 0 |
| 2 | 4.7 | 3.2 | 0 |
| 3 | 4.6 | 3.1 | 0 |
| 4 | 5.0 | 3.6 | 0 |
| 5 | 5.4 | 3.9 | 0 |
| 6 | 4.6 | 3.4 | 0 |
| 7 | 5.0 | 3.4 | 0 |
| 8 | 4.4 | 2.9 | 0 |
| 9 | 4.9 | 3.1 | 0 |
| 10 | 5.4 | 3.7 | 0 |
| 11 | 4.8 | 3.4 | 0 |
| 12 | 4.8 | 3.0 | 0 |
| 13 | 4.3 | 3.0 | 0 |
| 14 | 5.8 | 4.0 | 0 |
| 15 | 5.7 | 4.4 | 0 |
| 16 | 5.4 | 3.9 | 0 |
| 17 | 5.1 | 3.5 | 0 |
| 18 | 5.7 | 3.8 | 0 |
| 19 | 5.1 | 3.8 | 0 |
| 20 | 5.4 | 3.4 | 0 |
| 21 | 5.1 | 3.7 | 0 |
| 22 | 4.6 | 3.6 | 0 |
| 23 | 5.1 | 3.3 | 0 |
| 24 | 4.8 | 3.4 | 0 |
| 25 | 5.0 | 3.0 | 0 |
| 26 | 5.0 | 3.4 | 0 |
| 27 | 5.2 | 3.5 | 0 |
| 28 | 5.2 | 3.4 | 0 |
| 29 | 4.7 | 3.2 | 0 |
| 30 | 4.8 | 3.1 | 0 |
| 31 | 5.4 | 3.4 | 0 |
| 32 | 5.2 | 4.1 | 0 |
| 33 | 5.5 | 4.2 | 0 |
| 34 | 4.9 | 3.1 | 0 |
| 35 | 5.0 | 3.2 | 0 |
| 36 | 5.5 | 3.5 | 0 |
| 37 | 4.9 | 3.6 | 0 |
| 38 | 4.4 | 3.0 | 0 |
| 39 | 5.1 | 3.4 | 0 |
| 40 | 5.0 | 3.5 | 0 |
| 41 | 4.5 | 2.3 | 0 |
| 42 | 4.4 | 3.2 | 0 |
| 43 | 5.0 | 3.5 | 0 |
| 44 | 5.1 | 3.8 | 0 |
| 45 | 4.8 | 3.0 | 0 |
| 46 | 5.1 | 3.8 | 0 |
| 47 | 4.6 | 3.2 | 0 |
| 48 | 5.3 | 3.7 | 0 |
| 49 | 5.0 | 3.3 | 0 |
python
class_1 = df[df["target"] == 1]
class_1
| sepal length (cm) | sepal width (cm) | target | |
|---|---|---|---|
| 50 | 7.0 | 3.2 | 1 |
| 51 | 6.4 | 3.2 | 1 |
| 52 | 6.9 | 3.1 | 1 |
| 53 | 5.5 | 2.3 | 1 |
| 54 | 6.5 | 2.8 | 1 |
| 55 | 5.7 | 2.8 | 1 |
| 56 | 6.3 | 3.3 | 1 |
| 57 | 4.9 | 2.4 | 1 |
| 58 | 6.6 | 2.9 | 1 |
| 59 | 5.2 | 2.7 | 1 |
| 60 | 5.0 | 2.0 | 1 |
| 61 | 5.9 | 3.0 | 1 |
| 62 | 6.0 | 2.2 | 1 |
| 63 | 6.1 | 2.9 | 1 |
| 64 | 5.6 | 2.9 | 1 |
| 65 | 6.7 | 3.1 | 1 |
| 66 | 5.6 | 3.0 | 1 |
| 67 | 5.8 | 2.7 | 1 |
| 68 | 6.2 | 2.2 | 1 |
| 69 | 5.6 | 2.5 | 1 |
| 70 | 5.9 | 3.2 | 1 |
| 71 | 6.1 | 2.8 | 1 |
| 72 | 6.3 | 2.5 | 1 |
| 73 | 6.1 | 2.8 | 1 |
| 74 | 6.4 | 2.9 | 1 |
| 75 | 6.6 | 3.0 | 1 |
| 76 | 6.8 | 2.8 | 1 |
| 77 | 6.7 | 3.0 | 1 |
| 78 | 6.0 | 2.9 | 1 |
| 79 | 5.7 | 2.6 | 1 |
| 80 | 5.5 | 2.4 | 1 |
| 81 | 5.5 | 2.4 | 1 |
| 82 | 5.8 | 2.7 | 1 |
| 83 | 6.0 | 2.7 | 1 |
| 84 | 5.4 | 3.0 | 1 |
| 85 | 6.0 | 3.4 | 1 |
| 86 | 6.7 | 3.1 | 1 |
| 87 | 6.3 | 2.3 | 1 |
| 88 | 5.6 | 3.0 | 1 |
| 89 | 5.5 | 2.5 | 1 |
| 90 | 5.5 | 2.6 | 1 |
| 91 | 6.1 | 3.0 | 1 |
| 92 | 5.8 | 2.6 | 1 |
| 93 | 5.0 | 2.3 | 1 |
| 94 | 5.6 | 2.7 | 1 |
| 95 | 5.7 | 3.0 | 1 |
| 96 | 5.7 | 2.9 | 1 |
| 97 | 6.2 | 2.9 | 1 |
| 98 | 5.1 | 2.5 | 1 |
| 99 | 5.7 | 2.8 | 1 |
python
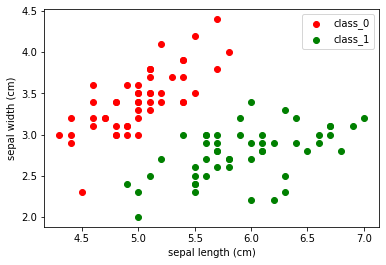
plt.scatter(class_0["sepal length (cm)"], class_0["sepal width (cm)"], color = "r", label = "class_0")
plt.scatter(class_1["sepal length (cm)"], class_1["sepal width (cm)"], color = "g", label = "class_1")
plt.xlabel("sepal length (cm)")
plt.ylabel("sepal width (cm)")
plt.legend()
<matplotlib.legend.Legend at 0xbc19f10>
python
X_train, X_test, y_train, y_test = train_test_split(X, y, test_size = 0.3, random_state = 42)
python
knn = neighbors.KNeighborsClassifier(n_neighbors= 5)
python
knn.fit(X_train, y_train)
KNeighborsClassifier()
python
y_predict = knn.predict(X_test)
python
np.vstack([y_test, y_predict]).T
array([[1, 1],
       [1, 1],
       [1, 1],
       [0, 0],
       [0, 0],
       [0, 0],
       [0, 0],
       [1, 1],
       [0, 0],
       [0, 0],
       [0, 0],
       [0, 0],
       [1, 1],
       [0, 0],
       [1, 1],
       [0, 0],
       [1, 1],
       [1, 1],
       [0, 0],
       [0, 0],
       [1, 1],
       [1, 1],
       [0, 0],
       [0, 0],
       [1, 1],
       [0, 0],
       [0, 0],
       [1, 1],
       [0, 0],
       [1, 1]])
python
knn.score(X_test, y_test)
1.0
python
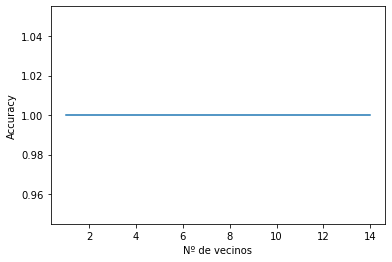
score_list = []
for i in range(1, 15):
    knn_test = neighbors.KNeighborsClassifier(n_neighbors= i)
    knn_test.fit(X_train, y_train)
    score_list.append(knn_test.score(X_test, y_test))
score_list
[1.0, 1.0, 1.0, 1.0, 1.0, 1.0, 1.0, 1.0, 1.0, 1.0, 1.0, 1.0, 1.0, 1.0]
python
plt.plot(range(1, 15), score_list)
plt.xlabel("Nº de vecinos")
plt.ylabel("Accuracy")
plt.show()
python
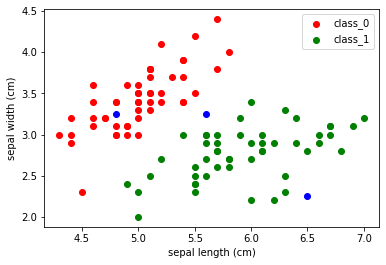
plt.scatter(class_0["sepal length (cm)"], class_0["sepal width (cm)"], color = "r", label = "class_0")
plt.scatter(class_1["sepal length (cm)"], class_1["sepal width (cm)"], color = "g", label = "class_1")
plt.scatter(4.8, 3.25, color = "b")
plt.scatter(6.5, 2.25, color = "b")
plt.scatter(5.6, 3.25, color = "b")

plt.xlabel("sepal length (cm)")
plt.ylabel("sepal width (cm)")
plt.legend()
<matplotlib.legend.Legend at 0xd00bfd0>
python
X_test.values
array([[6. , 2.7],
       [5.5, 2.3],
       [5.9, 3.2],
       [4.8, 3. ],
       [5.1, 3.8],
       [5.1, 3.4],
       [4.6, 3.6],
       [5.5, 2.4],
       [5.4, 3.7],
       [5.1, 3.5],
       [5.7, 3.8],
       [4.8, 3.1],
       [6.1, 2.8],
       [5.5, 4.2],
       [5.5, 2.6],
       [5. , 3.6],
       [6.8, 2.8],
       [6.7, 3. ],
       [4.8, 3. ],
       [5.4, 3.4],
       [5.7, 2.8],
       [5.6, 3. ],
       [5. , 3.4],
       [4.4, 3.2],
       [5.6, 2.5],
       [5.7, 4.4],
       [5. , 3.5],
       [5.7, 2.9],
       [4.9, 3.1],
       [6.3, 2.5]])
python
new_points = [[4.8, 3.25],
             [6.5, 2.25],
             [5.6, 3.25]]
python
knn.predict(new_points)
array([0, 1, 1])